
The Hidden Cost of Disease: Linking Broiler Chicken Health, Carbon Footprint, and Farm Profitability
Modern poultry production is built on one central biological assumption: that dietary nutrients will preferentially move toward productive tissue deposition.
यह आर्टिकल नीचे हिंदी में भी समझाया गया है –
Everything in commercial broiler genetics — high breast yield, rapid growth rate, low FCR, uniformity — depends on this assumption remaining metabolically stable.
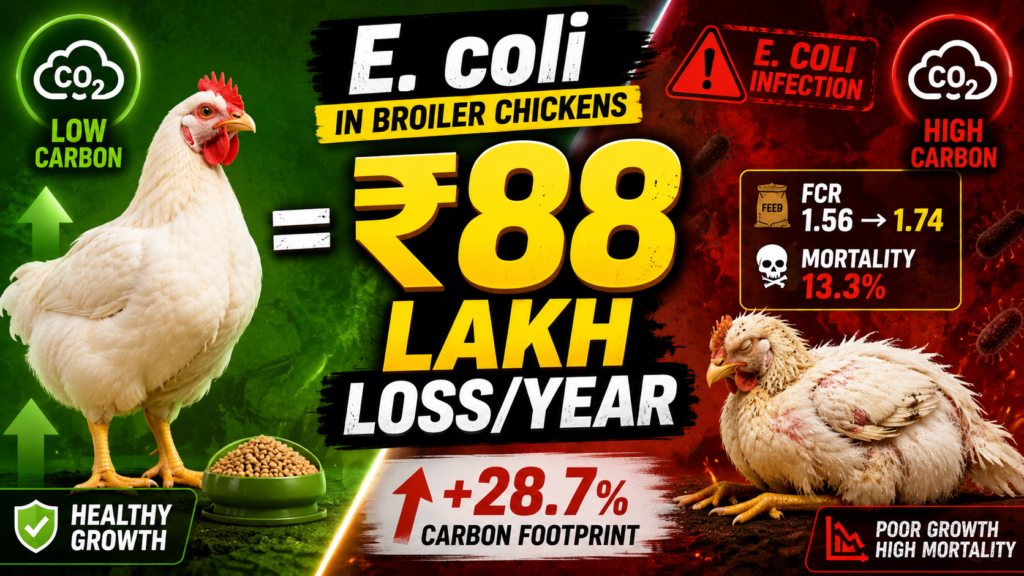
But infectious disease fundamentally breaks this biological contract.
Most field discussions around E. coli still remain reductionist:
“respiratory infection,”
“colibacillosis,”
“poor immunity,”
“wet litter,”
“mortality.”
How E.coli causes higher FCR is matter of investigation. Yet the deeper reality is that E. coli is not merely damaging organs. It is redirecting nutrient economics inside the bird.
And once this metabolic redirection begins, FCR deterioration becomes inevitable — even before severe clinical signs appear.
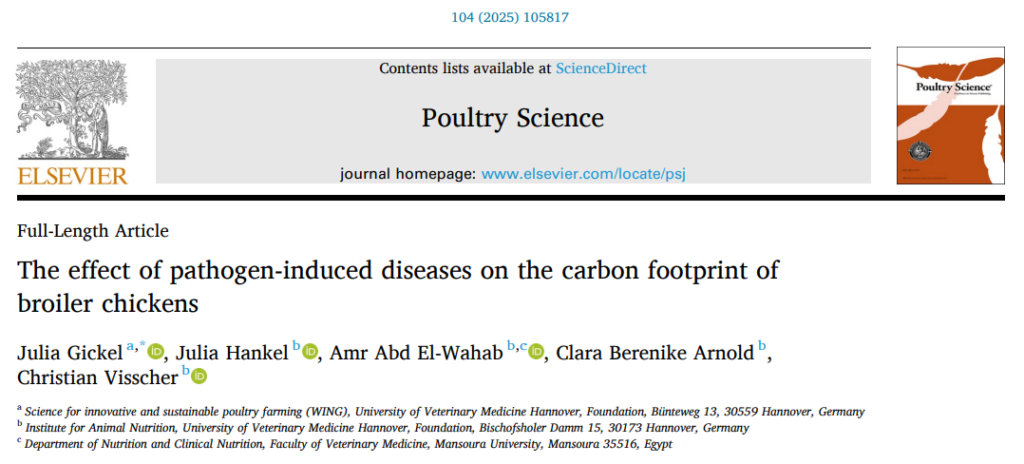
The recent Poultry Science paper on pathogen-induced disease and carbon footprint provides important quantitative evidence for this concept. But the biological implications go much deeper than environmental sustainability.
The Economic and Environmental Cost of E. coli in Broilers: Integrating Immune Challenge, Carbon Footprint, and Farm Profitability
Among all bacterial threats to commercial broiler production, Avian Pathogenic Escherichia coli (APEC) —the cause of colibacillosis—stands out as a silent profit killer. It does not always cause dramatic outbreaks, but its chronic and acute effects on feed efficiency, growth, and mortality carry a heavy price. Recent research (Gickel et al., 2025, Poultry Science) provides the first quantified link between E. coli infection and the carbon footprint (CF) of broiler meat. But more importantly for producers, this environmental metric translates directly into feed waste, higher mortality, and lower margins.
This article breaks down the hard data—including metabolic cost of immune challenge—and shows you exactly how E. coli impacts your farm’s bottom line, and what you can do about it.
1. The Metabolic Cost of Immune Challenge: What the Oxygen and Heat Data Tell Us
Before we talk about carbon or costs, we must understand what happens inside an E. coli‑infected bird at the cellular level. The bird’s immune system does not work for free. It diverts energy away from growth toward inflammation, cytokine production, and immune cell proliferation.
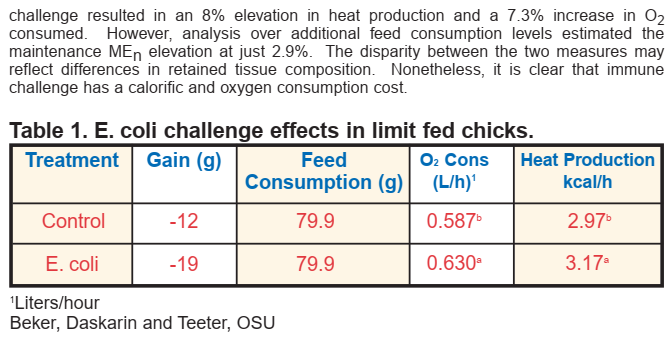
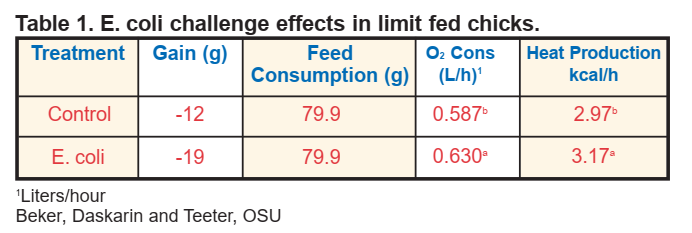
A classic trial (Beker, Daskarin & Teeter, OSU) using limit‑fed chicks (feed held constant so that differences in heat production are not masked by reduced feed intake) clearly demonstrates this metabolic shift:
Table 1: E. coli challenge effects in limit‑fed chicks

Key changes:
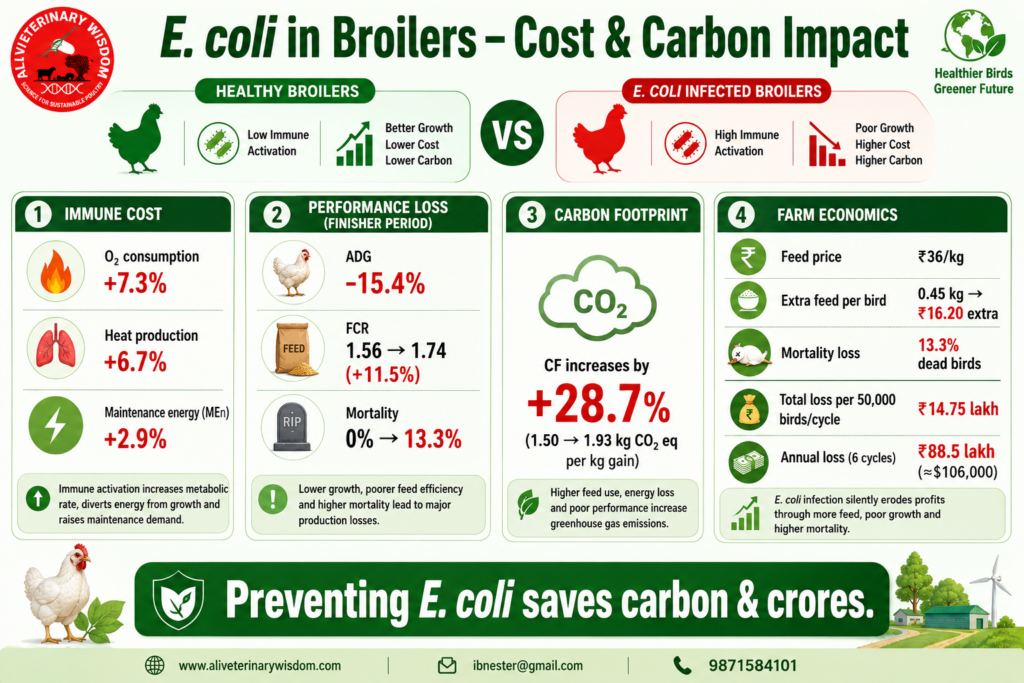
- Oxygen consumption increased by 7.3% (0.587 → 0.630 L/h)
- Heat production increased by 6.7% (2.97 → 3.17 kcal/h)
- Estimated maintenance MEn (net energy for maintenance) increased by 2.9%
Because feed intake was identical, the E. coli‑infected birds burned more energy just to stay alive and fight infection. That extra energy came directly from reduced tissue gain – the infected group lost 7 grams more body weight than the control group over the same period.
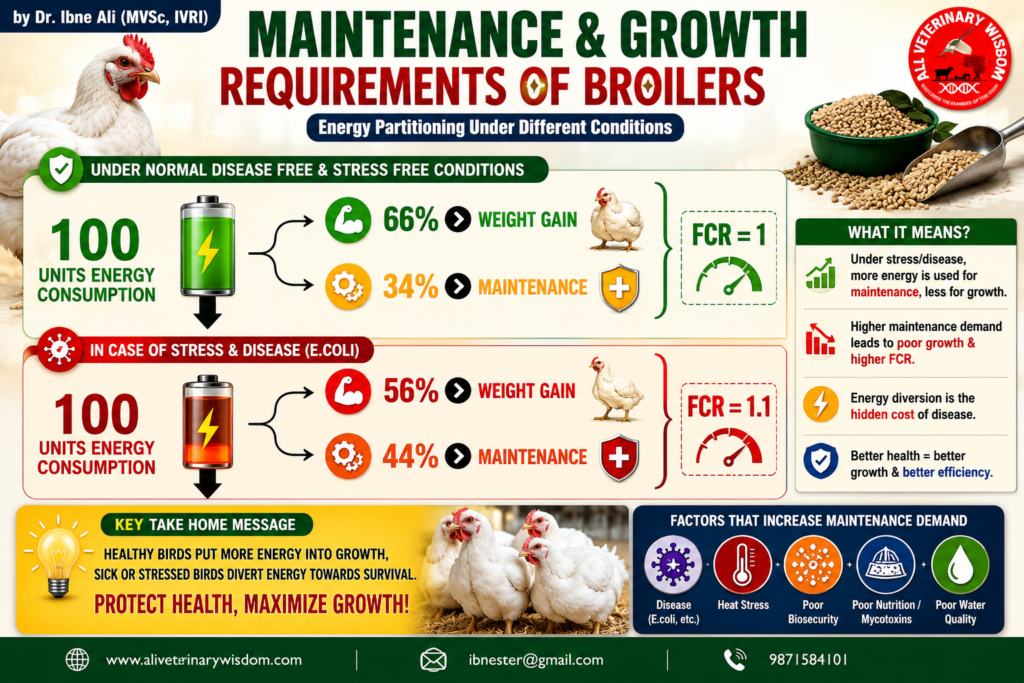
This immune maintenance cost is the root cause of poorer feed conversion ratio (FCR), slower growth, and ultimately a larger carbon footprint.
2. Quantifying Performance Loss from E. coli Infection
The Gickel et al. (2025) meta‑analysis included 28 trials (2002–2022) comparing non‑infected and E. coli‑infected broilers under experimental conditions. The results are presented separately for finisher period (≥15 days of age) and entire lifespan to highlight when the damage is worst.
A. Finisher Period (Days 15+ – Most Critical Phase)
| Parameter | Non‑infected | E. coli‑infected | Change |
|---|---|---|---|
| Average Daily Gain (ADG), g/day | 46.9 | 39.7 | –15.4% |
| Feed Conversion Ratio (FCR) | 1.56 | 1.74 | +11.5% |
| Mortality rate (%) | 0% | 13.3% | +13.3 points |
Carbon footprint impact (finisher period only):
Non‑infected CF = 1.50 kg CO₂ eq per kg gain → Infected CF = 1.93 kg CO₂ eq per kg gain
👉 Increase of +28.7%
B. Entire Lifespan (Day 1 to slaughter)
| Parameter | Non‑infected | E. coli‑infected | Change |
|---|---|---|---|
| ADG (g/day) | 38.4 | 35.3 | –8.1% |
| FCR | 1.71 | 1.82 | +6.4% |
| Mortality rate (%) | 0.6% | 3.9% | +3.3 points |
Carbon footprint impact (entire lifespan):
Non‑infected CF = 1.71 kg CO₂ eq per kg gain → Infected CF = 1.89 kg CO₂ eq per kg gain
👉 Increase of +10.5%
Critical insight: The finisher period is where E. coli does the most economic damage. A 13.3% mortality spike + 11.5% FCR increase means you are losing nearly ready‑to‑market birds while wasting large amounts of expensive finisher feed. That is why the carbon footprint jumps by almost 29% during this phase.
3. Translating Carbon Footprint into Farm Economics: A Practical Model (₹36/kg Feed Cost)
The carbon footprint numbers (kg CO₂ eq per kg gain) are useful for sustainability reporting, but producers need rupees or dollars. Here is how to convert the E. coli‑induced performance loss into direct costs on a typical farm using current feed price of ₹36 per kg.
Assumptions for a mid‑sized commercial farm:
- Birds per cycle: 50,000
- Target market weight: 2.5 kg
- Feed price: ₹36 per kg (current market rate)
- Cycles per year: 6
Step 1: Extra feed cost from worsened FCR
- Baseline (non‑infected) FCR = 1.56 → Feed per bird = 1.56 × 2.5 = 3.90 kg
- E. coli infected FCR = 1.74 → Feed per bird = 1.74 × 2.5 = 4.35 kg
- Extra feed per bird = 0.45 kg
- Extra feed cost per bird = 0.45 kg × ₹36 = ₹16.20
- For 50,000 birds = ₹8,10,000 per cycle
Step 2: Direct loss from increased mortality (finisher period)
- Baseline mortality = 0% → Infected mortality = 13.3%
- Extra dead birds = 13.3% of 50,000 = 6,650 birds
- Average cost of a bird at point of death (day‑old chick + feed + medecine up to that age) ≈ ₹100 (updated to reflect current feed prices)
- Mortality loss = 6,650 × ₹100 = ₹6,65,000 per cycle
Step 3: Total direct economic loss per cycle (finisher outbreak)
- Feed waste + mortality = ₹8,10,000 + ₹6,65,000 = ₹14,75,000
- Per year (6 cycles) = ₹88,50,000 (approx. $106,000 USD at current exchange rates)
This figure does not include additional veterinary treatment, labour for disposal, reduced slaughter weight of surviving birds, or potential penalties for high carbon emissions in regulated markets. The real loss is even higher.
4. The Maintenance & Immune Challenge Cost – Connecting the Dots
Recall the metabolic data: infected birds increased heat production by 6.7% and oxygen consumption by 7.3%, while maintenance MEn rose 2.9%. How does that translate to the economic losses above?
- The 2.9% increase in maintenance MEn means that for every 100 kcal of feed energy that should have gone into growth, nearly 3 kcal are “stolen” by the immune system.
- Over a full grow‑out, this energy theft accumulates. For a bird consuming approximately 8,000 kcal ME total, a 2.9% maintenance penalty equals 232 kcal lost from potential gain.
- In real terms, that lost energy represents about 60–80 g less final body weight or, more commonly, a higher FCR (as seen: 1.56 → 1.74).
The maintenance cost is not a fixed number; it scales with disease severity. The 2.9% MEn increase measured in a short, limit‑fed trial likely underestimates the full cost under commercial conditions where birds eat ad libitum and exposure may be prolonged.
5. Scenario Analysis: What Prevention Could Save
The Gickel study included a scenario analysis for Germany, but the method applies anywhere. Using the standard CF of 1.8 kg CO₂ eq per kg gain (industry average for many regions), the potential savings from preventing E. coli are:
| Scenario | CO₂ saved per 1000 kg gain | Annual CO₂ saving (Germany example) |
|---|---|---|
| Prevention in finisher period | 517 kg CO₂ eq | 416,000 metric tons |
| Prevention over entire lifespan | 189 kg CO₂ eq | 152,000 metric tons |
For a single 50,000‑bird farm adopting effective E. coli prevention (e.g., improved biosecurity + vaccination + acidifiers), the annual reduction in CO₂ emissions would be roughly:
- CF baseline = 1.80 kg CO₂/kg gain
- CF with full prevention = 1.80 / 1.287 ≈ 1.40 kg CO₂/kg gain (assuming finisher prevention)
- Annual production = 50,000 birds × 6 cycles × 2.5 kg = 750,000 kg gain
- CO₂ saved = 750,000 × (1.80 – 1.40) = 300 metric tons CO₂ eq per farm per year
That is equivalent to taking 65 passenger cars off the road annually – and it comes with the ₹88.5 lakh (≈$106,000) annual economic savings mentioned earlier.
6. Actionable Farm Management Plan to Reduce E. coli Impact
Based on the data (both metabolic and performance), here is a step‑by‑step protocol to lower your carbon footprint and improve profits.
Step 1: Lock down biosecurity – highest ROI
- E. coli is often secondary to respiratory or gut damage. Control ammonia (<10 ppm) and dust. For ammonia prevention use Ammobond (5kg/2500 birds).
- Implement strict all‑in/all‑out barn management.
- Disinfect water lines between flocks – E. coli thrives in biofilms.
Step 2: Monitor finisher period closely (Days 21–35)
- Track daily mortality. If mortality exceeds 0.3% per day for two consecutive days, perform necropsy.
- Look for pericarditis (fluid around heart), air sacculitis, and cellulitis – hallmark signs of colibacillosis.
Step 3: Use targeted interventions, not blanket antibiotics
- Vaccination: Autogenous or commercial E. coli vaccines are available and have been shown in several trials to reduce mortality by 50–70%. Not available in India widely.
- Probiotics (e.g., Lactobacillus, Enterococcus faecium) and prebiotics (mannan‑oligosaccharides) reduce gut colonization by APEC. Use Remipro (contains lactobacillus, gut conditioners and vitamin C)
- Organic acids in water (formic, propionic) lower bacterial load.
- Antibiotics (judicious use): Only when confirmed outbreak. Avoid prophylactic use to prevent resistance.
Step 4: Adjust feeding strategy
- Lower crude protein with balanced amino acids can reduce undigested protein in the hindgut, which E. coli uses as a substrate.
- Consider feed additives that strengthen gut barrier (e.g., zinc, butyrate, essential oils).
Step 5: Calculate your own “Cost of Inaction”
Use the formula from Section 3. If your current FCR is 1.70 and your mortality is 5%, calculate:
- Potential FCR if fully healthy = 1.56 → difference = 0.14
- Annual feed consumption (in kg) × 0.14 × ₹36 = annual feed waste.
- Add mortality loss. That number is your annual preventable loss.
7. Key Takeaways for the Broiler Producer (with ₹36/kg feed)
| Aspect | Without E. coli | With E. coli (finisher) | Farm impact |
|---|---|---|---|
| ADG (g/day) | 46.9 | 39.7 | +2–3 days to reach market weight |
| FCR | 1.56 | 1.74 | 450 kg extra feed per 1000 birds |
| Mortality | 0% | 13.3% | 133 additional dead birds per 1000 |
| Carbon footprint | 1.50 kg CO₂/kg | 1.93 kg CO₂/kg (+28.7%) | Higher emissions = potential market penalty |
| Extra feed cost per 1000 birds | – | 450 kg × ₹36 = ₹16,200 | Direct feed waste |
| Mortality loss per 1000 birds | – | 133 birds × ₹100 = ₹13,300 | Direct loss |
| Total loss per 50,000 bird cycle | – | ₹14,75,000 | ₹88.5 lakh/year (6 cycles) |
Conclusion: Healthy Broilers = Lower Carbon + Higher Profit (Even at ₹36/kg Feed)
The data are clear: E. coli infection imposes a measurable metabolic maintenance cost (higher O₂ consumption, higher heat production, reduced net energy for gain), which translates into worse FCR, higher mortality, and a 10–29% larger carbon footprint. But beyond environmental metrics, the economic hit is severe – upwards of ₹88.5 lakh (≈$106,000) per year on a medium‑sized farm, based on current feed prices of ₹36/kg.
Prevention – through biosecurity, vaccination, probiotics, and judicious use of acidifiers – does not just reduce CO₂ emissions. It puts real money back into your pocket. Every point of FCR saved and every bird alive at slaughter is both a sustainability win and a profitability win.
The question is no longer whether to control E. coli, but how fast you can implement these proven strategies.
In next article we will see the sources of E.coli in farm and its prevention.
ई. कोलाई बीमारी का ब्रॉयलर फार्म पर असर – सीधी भाषा में समझें
1. बीमारी चूजे की ताकत कैसे चुराती है?
जब चूजा ई. कोलाई से बीमार होता है, तो उसका शरीर बढ़ने के बजाय बीमारी से लड़ने में एनर्जी लगाता है।
- ऑक्सीजन की खपत 7.3% बढ़ जाती है।
- शरीर में गर्मी पैदा करने की दर 6.7% बढ़ जाती है।
- यानी, जो दाना बढ़वार में लगना चाहिए था, वो बीमारी से लड़ने में जल जाता है।
2. परफॉरमेंस पर क्या असर पड़ता है?
वैज्ञानिक अध्ययनों (Gickel et al. 2025) के मुताबिक:
फिनिशर पीरियड (15 दिन से अधिक उम्र) में:
- रोज की बढ़वार (ADG) 15.4% घट जाती है
- फीड कन्वर्जन रेशियो (FCR) यानी 1 किलो मांस के लिए दाना 11.5% बढ़ जाता है (1.56 से 1.74)
- मौत दर 13.3% तक बढ़ जाती है
- कार्बन फुटप्रिंट 28.7% बढ़ जाता है (1.50 से 1.93 kg CO₂ प्रति kg मीट)
पूरी लाइफ (दिन 1 से कटाई तक):
- ADG में 8.1% की गिरावट
- FCR में 6.4% की बढ़ोतरी
- मौत दर 3.9% (जो सामान्य स्थिति में 0.6% है)
- कार्बन फुटप्रिंट 10.5% बढ़ता है
सबसे बड़ा नुकसान फिनिशर पीरियड में होता है – जब चूजे लगभग तैयार हो चुके होते हैं, तब बीमारी से मरते हैं और दाना भी बर्बाद होता है।
3. अब सीधा आर्थिक नुकसान – ₹36/kg दाने के हिसाब से
मान लो आपके फार्म पर एक बार में 50,000 चूजे आते हैं, एक चूजा 2.5 किलो का होता है, और दाने का रेट ₹36 प्रति किलो है।
- बिना बीमारी वाला FCR = 1.56 → कुल दाना प्रति चूजा = 3.90 kg
- ई. कोलाई होने पर FCR = 1.74 → कुल दाना = 4.35 kg
- अतिरिक्त दाना प्रति चूजा = 0.45 kg
- अतिरिक्त लागत प्रति चूजा = 0.45 × 36 = ₹16.20
- 50,000 चूजों पर = ₹8,10,000 प्रति साइकिल (सिर्फ दाने की बर्बादी)
मौत से नुकसान:
13.3% मौत यानी 6,650 चूजे मरे
एक चूजे की कीमत (डे-ओल्ड + दाना + इलाज) लगभग ₹100 → कुल नुकसान = ₹6,65,000
कुल नुकसान एक साइकिल में = ₹8,10,000 + ₹6,65,000 = ₹14,75,000
अगर साल में 6 साइकिल चलते हैं, तो सालाना नुकसान ₹88.5 लाख (करीब 1 करोड़ रुपया)
4. कार्बन फुटप्रिंट बढ़ने का मतलब
ई. कोलाई से बचाव करने से हर 1000 किलो मीट उत्पादन पर 517 किलो CO₂ कम निकलेगी। एक मीडियम फार्म से सालाना 300 मीट्रिक टन CO₂ बच सकती है – जो लगभग 65 कारों को सड़क से हटाने के बराबर है।
5. क्या करें? (फार्म पर लगाने वाले उपाय)
- बायोसिक्योरिटी सख्त करें – अमोनिया कम रखें, पानी की लाइन साफ करें, ऑल इन ऑल आउट करें।
- फिनिशर पीरियड में नजर रखें – अगर एक दिन में 0.3% से ज्यादा मौत हो, तो पोस्टमार्टम कराएं।
- वैक्सीन और प्रोबायोटिक्स का इस्तेमाल करें – एंटीबायोटिक बचाकर रखें, सिर्फ जरूरत पर दें।
- फीड एडिटिव्स (ऑर्गेनिक एसिड, ब्यूटिरेट) आंतों को मजबूत बनाते हैं।
सीधी बात (टेकअवे)
ई. कोलाई की रोकथाम से आपको दोहरा फायदा है:
- पर्यावरणीय – कम CO₂ उत्सर्जन
- आर्थिक – हर साल करीब ₹88 लाख का नुकसान बच सकता है (50,000 बर्ड्स वाले फार्म में)
दाने के ₹36/kg के इस दौर में, बीमारी से बचाना सबसे सस्ता और सबसे कमाने वाला निवेश है।
नोट: यह जिस्ट Gickel एट अल. 2025 के अध्ययन और Beker, Daskarin & Teeter (OSU) के मेटाबॉलिक डेटा पर आधारित है।